Who's to say that 'north' should always be at the top of a map? Perhaps in certain situations, you might want 'south' (or some other direction) to be at the top. Perhaps you're one of our crazy Australian customers who looks at the world a little differently. Well, whatever the situation, SAS has got you covered! Follow along as I demonstrate how to use various pieces of SAS software to manipulate maps in several ways - with the end result being a fun upside down map.
And to get you into the mood for flipping a map upside down, here's a picture of my friend Eva standing on her head. How long has it been since you tried standing on your head? 🙂
Here's the original map I saw in a reddit post, that inspired me to create my SAS version. I suspect it was designed to be a decorative wall map, printed large enough to see all the small text detail. But it looks a bit crowded on a computer screen, and the text is mostly too small to read.

Subsetting the Map
SAS ships several maps, but none that cover just this exact rectangular area. I could subset the map from the SAS mapsgfk.namerica (or mapsgfk.world) by using a where clause on the latitude and longitude coordinates, but SAS provides a cleaner technique via options in Proc GProject.
proc gproject data=namerica out=namerica latlong eastlong degrees nodateline
latmax=55
latmin=12
longmin=-130
longmax=-60
project=cylindri
parmout=projparm;
id id;
run;
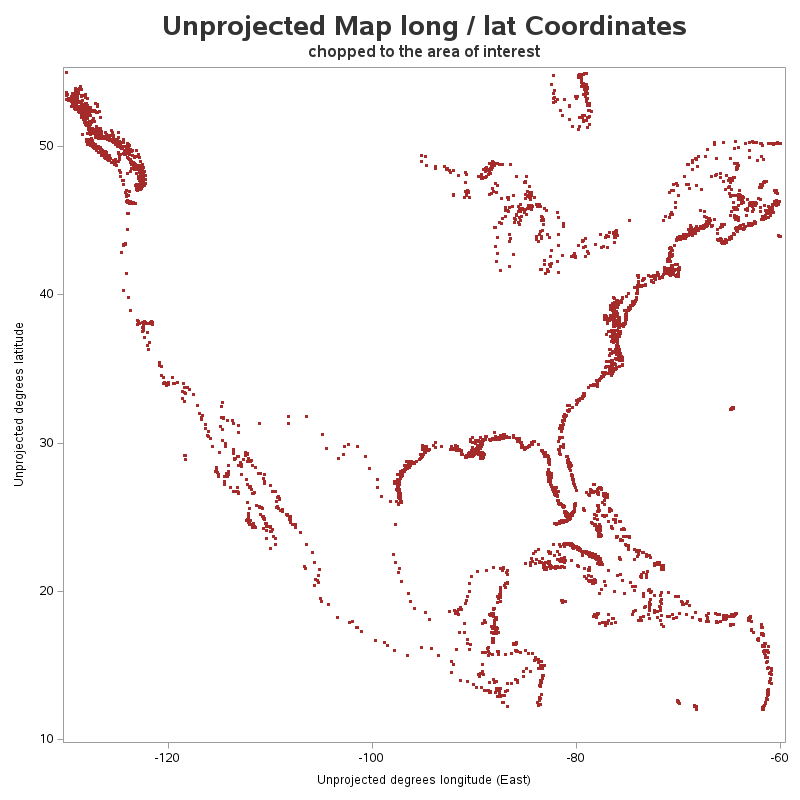
I next use a Proc SGPlot scatter plot of the unprojected lat/long values, and make sure I have the desired area. (The reason I use SGPlot rather than SGMap is that SGPlot includes an axis, which allows me to easily see the range of values and give them a quick sanity check.)
proc sgplot data=namerica;
scatter y=lat x=long / markerattrs=(size=3px color=brown symbol=circlefilled);
run;
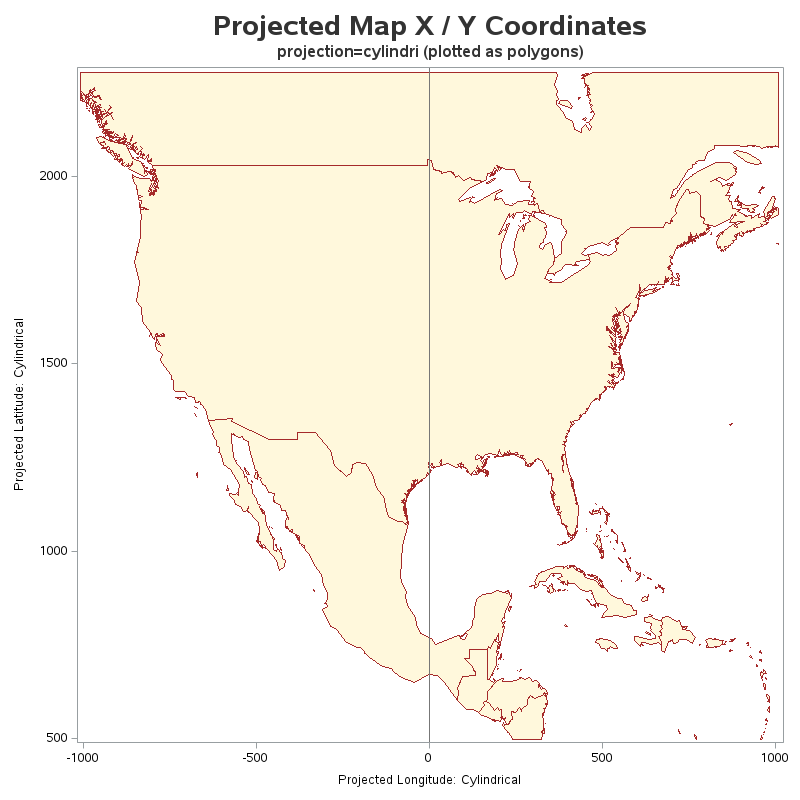
Or, to get a better feel for what the map polygons will look like, I can create a polygon plot of the projected x/y values, rather than a scatter plot of the unprojected points.
proc sgplot data=namerica;
polygon y=y x=x id=unique_id / fill fillattrs=(color=cornsilk) outline lineattrs=(color=brown);
refline 0 / axis=x lineattrs=(color=gray77);
refline 0 / axis=y lineattrs=(color=gray77);
run;
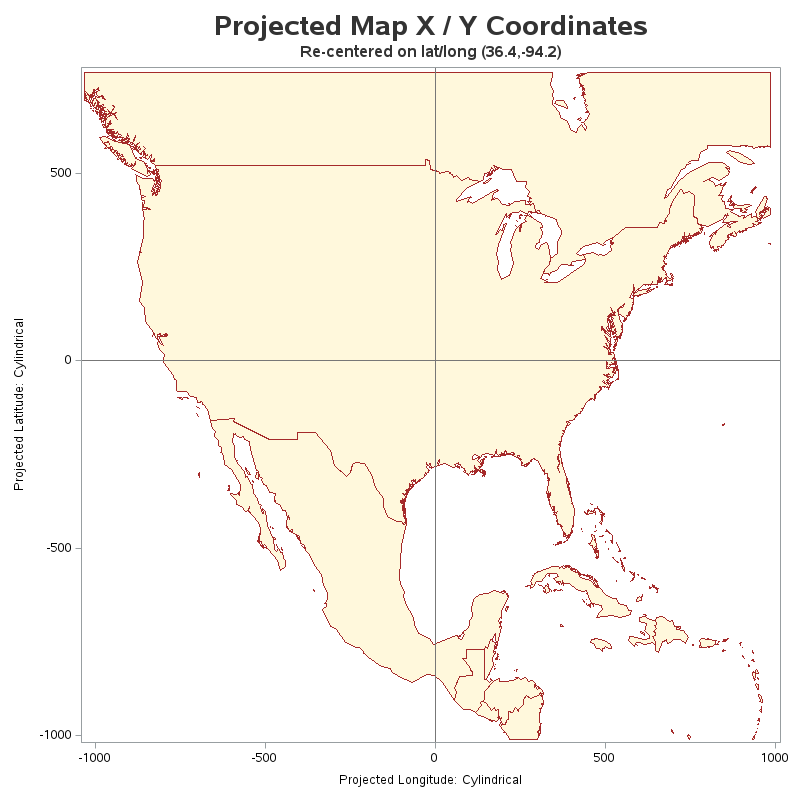
Centering the Map
Rotating polygon coordinates is easiest if they are centered at the (0,0) origin. And in my case, I want to rotate the map around the center of the United States. Therefore I start with the lat/long coordinates for Bentonville, AR (if it was a good enough center for Walmart, it's good enough for me!) I project those coordinates using the same parameters as were used in the map (via the parmin= option), and then subtract that offset from the projected x/y in my namerica map.
/* Center of rotation = Walmart headquarters: Bentonville, Arkansas */
%let latcenter=36.4;
%let longcenter=-94.2;
/* Create a dataset with the desired lat/long center of rotation */
data center;
lat=.; lat=&latcenter;
long=.; long=&longcenter;
run;
/* Project it the same as the map */
proc gproject data=center out=center latlong eastlong degrees nodateline
parmin=projparm parmentry=namerica;
id;
run;
/* Save the projected x/y values in macro variables, to use later */
data center; set center;
call symput ('x_center', x);
call symput ('y_center', y);
run;
/* Re-center the map, on the projected x/y (derived from the desired lat/long center) */
data namerica; set namerica;
x=x-&x_center;
y=y-&y_center;
run;
I plot the polygons again, and make sure the (0,0) origin is in the desired location (note that I use reflines which allow me to easily see the origin).
Rotating the Map
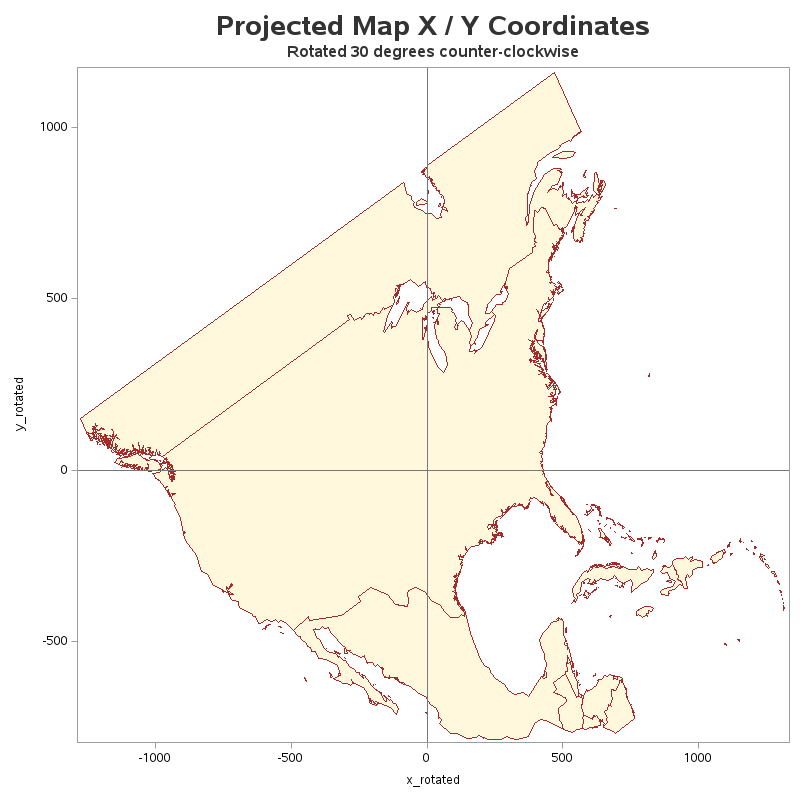
Now that I've used Proc GProject to clip out the rectangular area, and convert the lat/long to x/y coordinates, and I've re-centered the x/y coordinates on the desired center of rotation, I'm ready to rotate the coordinates. I did some Google searches and then derived my equations from this page. One thing you need to be aware of is that SAS's sin() and cos() functions work on radians, not degrees. Since most people think in terms of degrees, I specify the rotation angle in degrees, but then convert that to radians in the data step. My first test is to rotate the map 30 degrees counter-clockwise:
%let angle=30;
data namerica; set namerica;
angle_radians=&angle*(constant("pi")/180);
x_rotated=cos(angle_radians)*x - sin(angle_radians)*y;
y_rotated=sin(angle_radians)*x + cos(angle_radians)*y;
run;
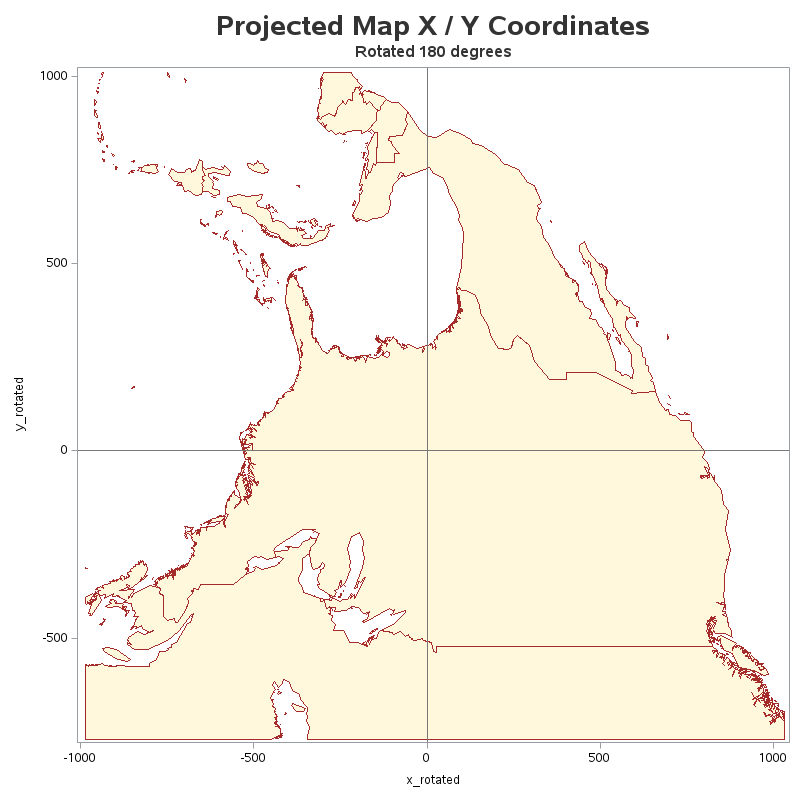
After testing 30 degrees, and a few other angles, I was satisfied that my rotation equations were working as desired, and I then applied the 180 degree rotation to flip the map upside down.
Plotting the Map
Now that I've got the coordinates rotated as desired, I can plot the coordinates as a proper choropleth map. Proc SGMap is a bit picky about the variables in the map dataset - you can't simply tell it to plot the x_rotated and y_rotated variables. SGMap either plots lat/long values, or x/y values. First, you have to get rid of the unprojected lat/long, so that SGMap will not use them (if they're in the dataset, SGMap uses them). And then you need to move/copy/rename the rotated values to the x/y variables. There are several different ways of accomplishing this game of musical chairs with the variables, and here's the one I used:
data namerica; set namerica (drop=lat long);
x=x_rotated;
y=y_rotated;
run;
proc sgmap mapdata=namerica maprespdata=mapsgfk.namerica_attr noautolegend;
choromap idname / mapid=id lineattrs=(thickness=1 color=gray88);
run;

Adding Labels
The original map had a lot of labels - too many, when viewed as a small map on a computer screen. Therefore I decided to just add country labels, and only for the largest countries. I use the %centroid() macro to estimate the center for each country, and then overlay the country names using Proc SGMap's text statement.
%annomac;
%centroid(namerica,namerica_labels,id idname,segonly=1);
data namerica_labels; set namerica_labels
(where=(idname in (
'Canada'
'United States'
'Mexico'
'Cuba'
)));
run;
proc sgmap mapdata=namerica maprespdata=mapsgfk.namerica_attr noautolegend plotdata=namerica_labels;
choromap idname / mapid=id lineattrs=(thickness=1 color=gray88);
text x=x y=y text=idname / textattrs=(size=14pt);
run;

Code
The code above is slightly summarized to make it easier to follow. Here's the full code, if you'd like a copy to experiment with. Do you have any ideas for using an upside down (or angled) map? Feel free to share in the comments!


1 Comment
Pingback: How to (mis)label a map - Graphically Speaking